
No scientific database records every unidentified object reported around the world. Countries use different reporting systems, many witnesses never file reports, and some databases rely entirely on voluntary submissions. A location with more reports may simply have a larger population, better internet access, more aircraft, or a reporting organization that people already know about. NASA also stresses that inconsistent and incomplete data make UAP patterns difficult to study scientifically.
California Leads One Major Civilian Database

As of July 22, 2026, the National UFO Reporting Center listed 17,228 reports from California—the highest raw total among U.S. states in its public database. Florida ranked second with 8,922, followed by Washington with 7,651, Texas with 6,747 and New York with 6,363. These are accumulated voluntary reports, not confirmed sightings of unusual technology.
Population Explains Part of the Pattern

California, Florida, Texas and New York are among America’s most populous states, giving them more potential observers. Washington stands out more strongly relative to its population, but even that does not establish unusual aerial activity. Weather, outdoor recreation, military aviation, astronomy interest, and awareness of reporting organizations can all influence how often residents submit accounts.
The American Northwest Produces Many Reports

Washington and Oregon have long produced substantial numbers of reports in the NUFORC database. Washington had 7,651 listed cases, while Oregon had 3,827. Clear viewing areas, dark rural skies and the organization’s strong recognition in the region may contribute to those totals. The figures cannot distinguish genuinely unexplained events from satellites, aircraft, meteors, balloons or misidentified stars.
International Rankings Are Even Harder

NUFORC listed more than 4,000 reports under the United Kingdom and substantial numbers from Australia, India and individual Canadian provinces. However, it is a U.S.-based, English-language reporting service, so its international totals are not a balanced measure of worldwide activity. Countries with different languages or government systems may record reports elsewhere—or not collect them centrally at all.
Military Reports Follow Sensors, Not Population
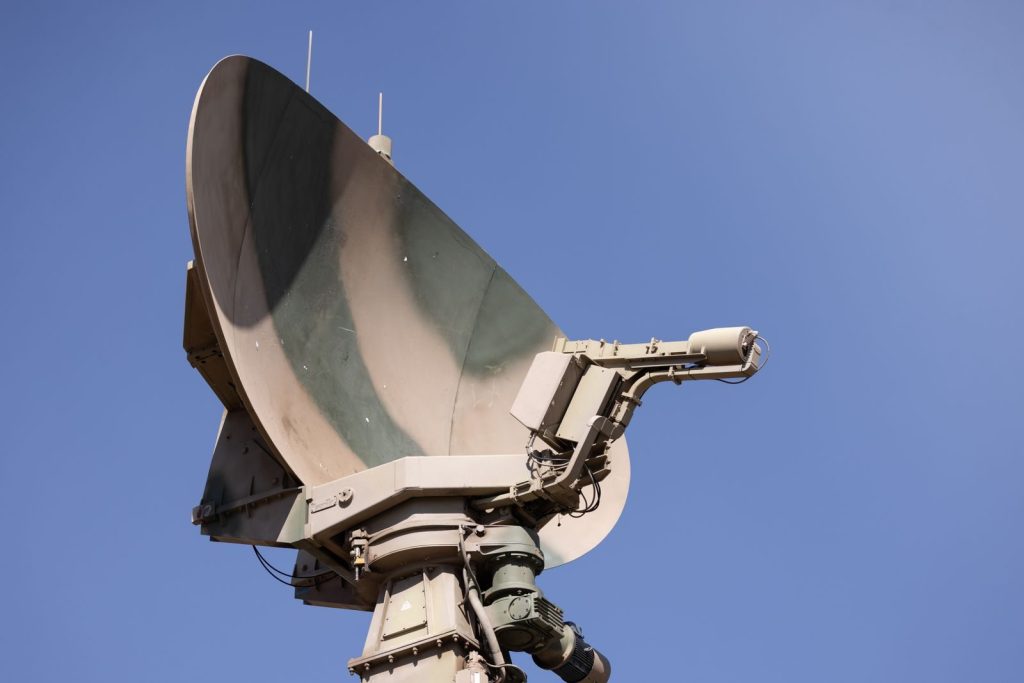
Official military data creates a different map. AARO’s fiscal year 2024 report noted a geographic collection bias around U.S. military assets and sensors. It received 100 reports from U.S. operations over the East Asian seas and 57 from the Middle East. Those numbers partly reflect where military aircraft, radar, and surveillance platforms were operating.
Many Hotspot Reports Have Ordinary Explanations
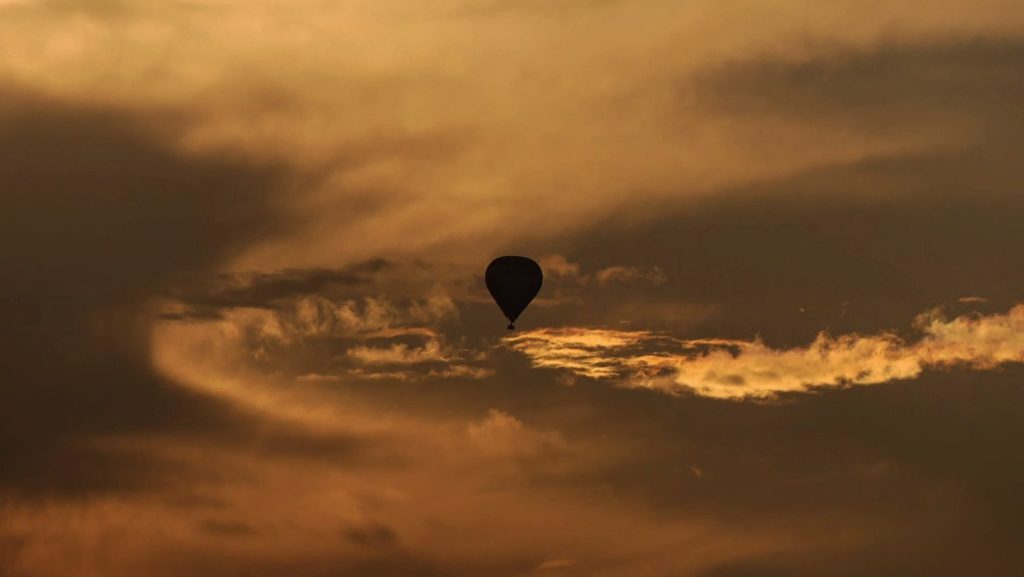
AARO resolved 40 of the 100 East Asian sea reports as balloons or uncrewed aircraft systems. Of the 57 Middle Eastern reports, 13 were attributed to balloons, drones or satellites, with two others initially assessed as possible satellite flares. Many remaining cases lacked enough information for a conclusion rather than displaying extraordinary capabilities.
More Reports Do Not Mean More Alien Visitors
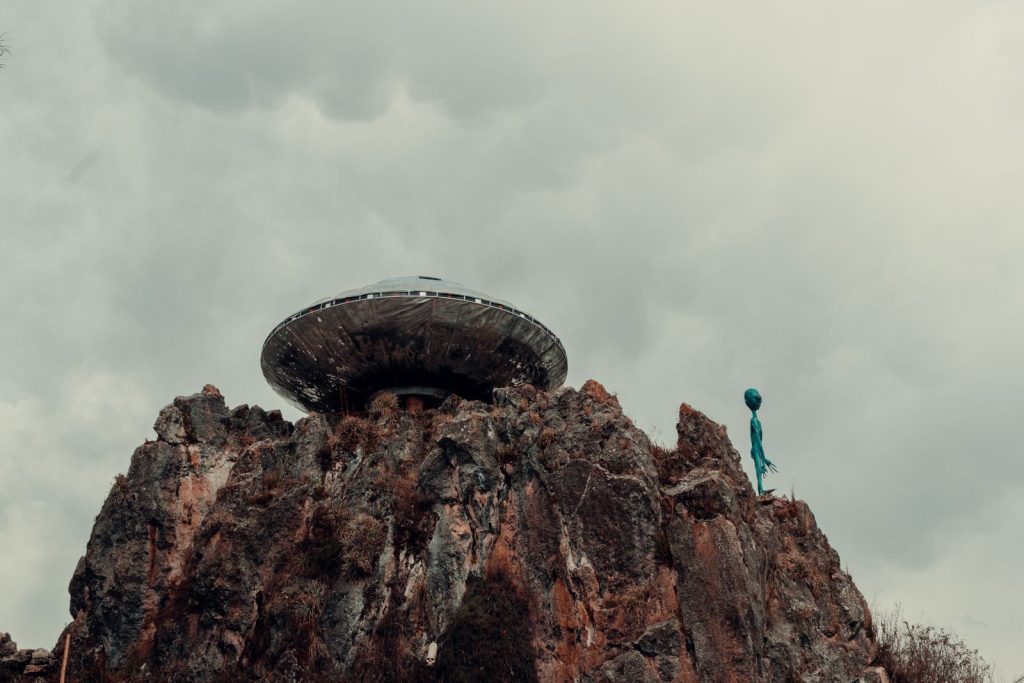
A UFO or UAP is unidentified at the time it is reported. It is not automatically extraterrestrial. Project Blue Book examined 12,618 reports between 1947 and 1969, leaving 701 unidentified, but the Air Force said it found no evidence that those cases represented extraterrestrial vehicles or technology beyond established scientific knowledge.
The Map Mostly Shows Where People Are Looking
The largest concentrations of reports appear where many people watch the sky, know how to submit sightings, and live near busy airspace or sophisticated sensors. California leads civilian raw totals, while current military reporting clusters around active operating regions. Neither map establishes where genuinely anomalous objects occur most often—or whether any reported object has an extraterrestrial origin.
Leave a Reply