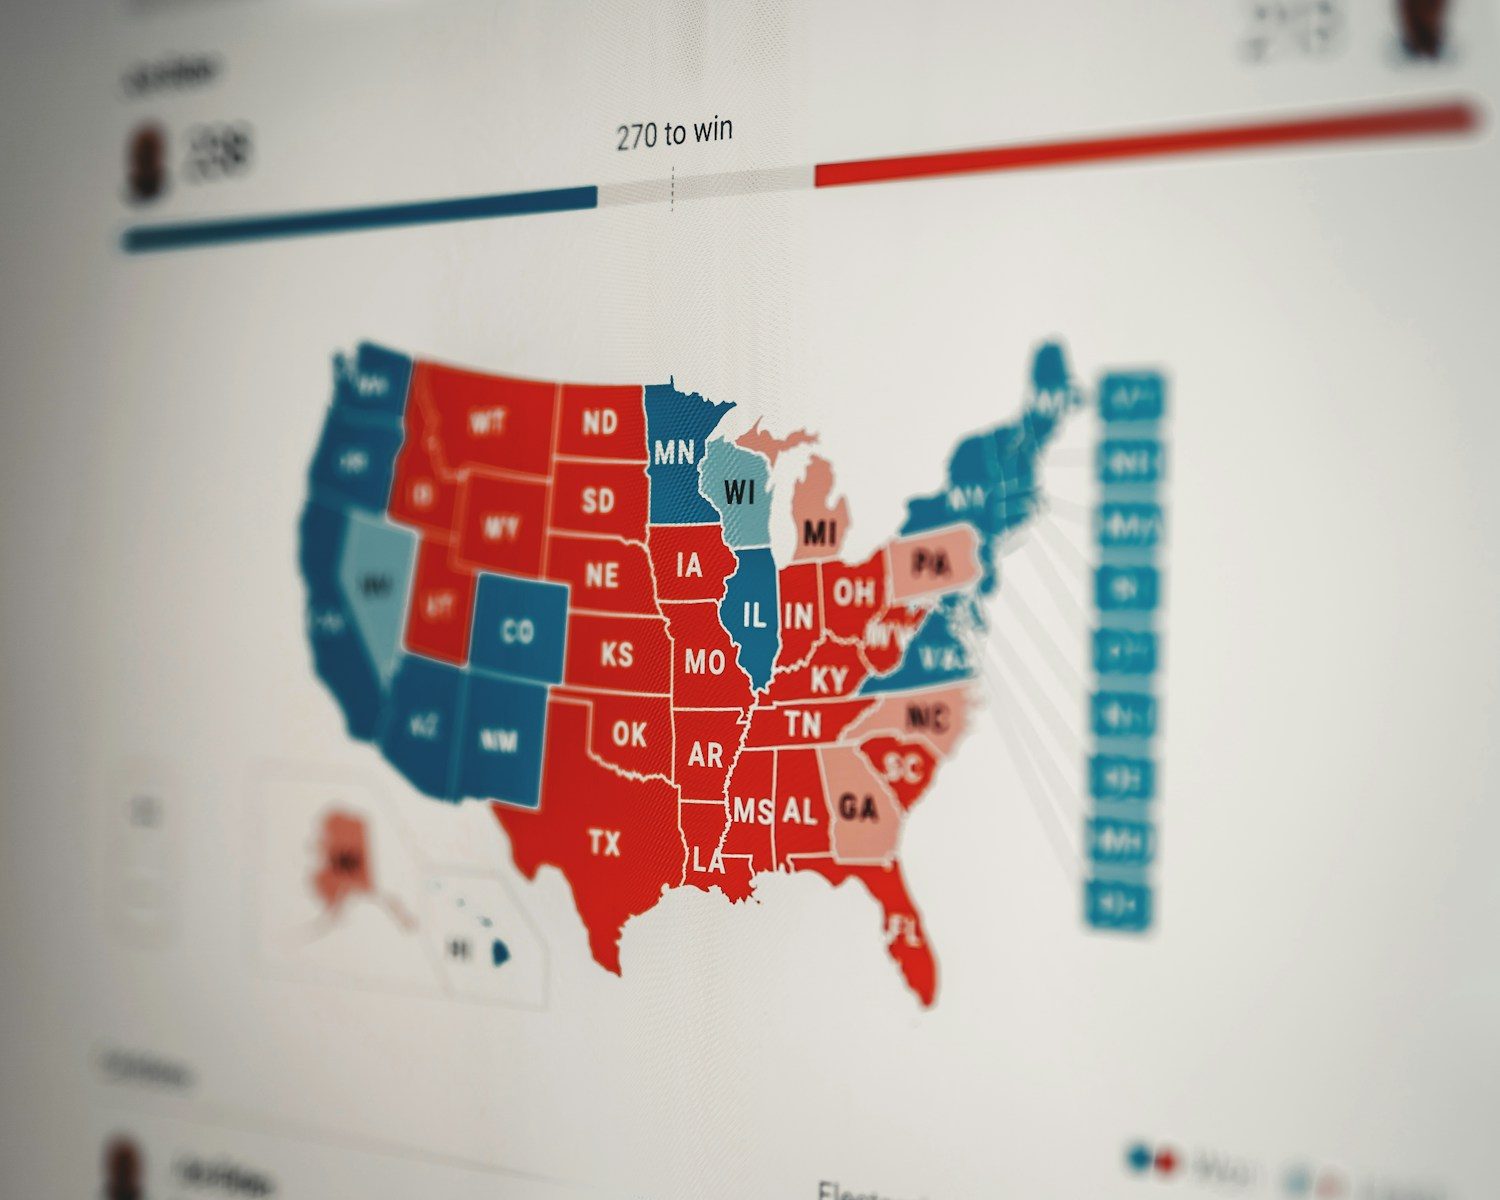
A major 2025 health assessment placed New Hampshire at the top of its state rankings, followed by Massachusetts, Vermont, Connecticut, and Utah. At the other end, Louisiana ranked last, followed by Arkansas, Mississippi, Alabama, and West Virginia. The results reveal large differences in health conditions across the United States.
The rankings do not simply measure hospitals or life expectancy. They combine information about health outcomes, medical care, personal behavior, environmental conditions, and social and economic circumstances. A high position does not mean every resident is healthy, while a low position does not mean every community faces the same problems.
United States Health Rankings Map Data

The assessment examined 99 measures of health and well-being gathered from 31 data sources. These included premature death, chronic illness, access to care, smoking, physical activity, housing, economic hardship, environmental conditions, and the availability of health professionals. The different measures were combined to create an overall picture of each state. Because the ranking covers far more than medical treatment, it also reflects the conditions in which people are born, work, raise families, and grow older.
New Hampshire Massachusetts Healthy Lifestyle Outdoor

New Hampshire ranked first, with Massachusetts, Vermont, Connecticut, and Utah completing the top five. These states differ in geography, population, and policy, showing that there is no single route to a strong health ranking. Their overall positions reflect performance across numerous measures rather than one outstanding statistic. Even top-ranked states continue to face challenges such as mental distress, unequal access, substance use, housing costs, rural care shortages, and chronic disease among particular communities.
Public Healthcare Access Clinic Community

New Hampshire’s first-place position represents the strongest combined score, not proof that it has solved every public health problem. State averages can hide major differences between counties, income groups, age groups, and rural and urban communities. Some residents may experience excellent access to care, while others face transportation, affordability, or provider shortages. Rankings are therefore best understood as broad comparisons. They can identify patterns, but they cannot fully describe the daily health experience of every person living within a state.
Rural Healthcare Clinic Hospital Shortage

Louisiana ranked 50th, followed by Arkansas, Mississippi, Alabama, and West Virginia. Several of these states have faced long-running challenges involving poverty, chronic disease, preventable deaths, rural hospital access, insurance coverage, and shortages of medical professionals. The rankings do not suggest that residents are personally responsible for these outcomes. Health is shaped by employment, education, housing, transportation, food access, environmental exposure, and the availability of affordable preventive treatment over many years.
Socioeconomic Health Factors Inequality Graph

A state can perform well in one area and poorly in another. It may have respected hospitals but high uninsured rates, or low smoking levels but severe housing and mental health pressures. Population age, geography, economic inequality, public investment, and local policy can all influence the results. Rural communities often face long travel distances and limited specialist care, while urban areas may struggle with pollution, housing instability, or neighborhood inequality. These overlapping factors make state health rankings more complex than a simple best-to-worst list.
Cancer Screening Preventive Medical Checkup

The national data included several encouraging changes. Premature deaths fell between 2022 and 2023, while drug deaths declined for the first time since 2018. Cancer screening increased, cigarette smoking decreased, and fewer adults reported being physically inactive. However, the picture remained mixed. Multiple chronic conditions became more common, e-cigarette use increased, and more people reported avoiding care because of cost. Homelessness also rose, showing how health improvements can occur alongside growing economic and social pressures.
Public Health Policy Analytics Dashboard

State rankings are most useful when they lead to better questions. Why are preventable deaths higher in one area? Which communities lack doctors, safe housing, or affordable food? What successful policies could other states adopt? Rankings should not become labels that celebrate one population and blame another. They are snapshots built from data collected during different periods. Their real value lies in showing where progress is happening, where serious gaps remain, and which health problems deserve greater attention. This article is for informational purposes only.
Featured Image: Photo by Clay Banks on Unsplash
Leave a Reply